Measuring Macroeconomic Data
Week 03
Instituto Universitário de Lisboa (ISCTE-IUL)
February 23, 2026
1. Measuring GDP
The Crucial Importance of Measurement
“While the GDP and the rest of the national accounts may seem to be arcane concepts, they are truly among the great inventions of modern times.”
Paul Samuelson and William Nordhaus, Nobel Prize winners
GDP stands for “Gross Domestic Product”
The Crucial Importance of Measurement
- Inaccurate/wrong measurements of macroeconomic aggregates may lead to dangerous or perverse policy measures.
- Private agents may make the wrong decisions.
- The state of the economy and our well-being may give a misleading view of the true state we are living in.
- In fact, in economics, there may be very few things more important than measuring correctly the main macroeconomic aggregates.
The Three Methods of Measuring GDP
- The Production Approach
- The Expenditure Approach
- The Income Approach
- They are alternative ways of estimating the same value
- Due to measurement errors they lead to approximate values for GDP
- Despite those errors they provide an excellent picture of economic activity in OECD economies
The Production Approach
Definition. GDP
In the production approach, we define GDP as the current market value of all final goods and services (G&S) newly produced in the economy during a given period of time.
- “Market value”: to exclude G&S not subject to market transactions
- “Final”: to exclude transactions of intermediate G&S
- “Newly”: to exclude transactions of G&S that were produced in the past
- “Given period”: to limit the period under consideration: a quarter, or a year
- \(GDP = \sum\) Gross Value Added by each firm \(i\)
Production Approach: Special Imputations
- Housing owner services:
- Rents are considered in the computation of GDP because it is a service being provided to someone and subject to a market transaction.
- The owner of a house does not pay rent, but is benefiting from a similar service.
- So, these services are treated as “implicit” rents and are considered in the calculation of GDP.
- Government provision of goods: public-goods like schooling, medical services, police, and others, are not subject to market transactions, but they are counted for GDP by their cost reported in the Budget.
- Inventories: firms’ holdings of raw materials, unfinished goods, and unsold finished goods and their value is included in the GDP.
The Expenditure Approach
- Contrary to the Production approach, in the current case we measure GDP by summing all transactions when agents buy final Goods & Services (G&S).
- The huge amount of those transactions can be aggregated into 4 basic categories:
\[Y = C + I + G + NX \tag{1}\]
- \(Y:\) GDP
- \(C:\) Personal Consumption Expenditures
- \(I:\) Investment Expenditures
- \(G:\) Government Expenditures (only on G&S)
- \(NX:\) Net Exports \(=\) Exports \(-\) Imports
The Expenditure Approach: An Example
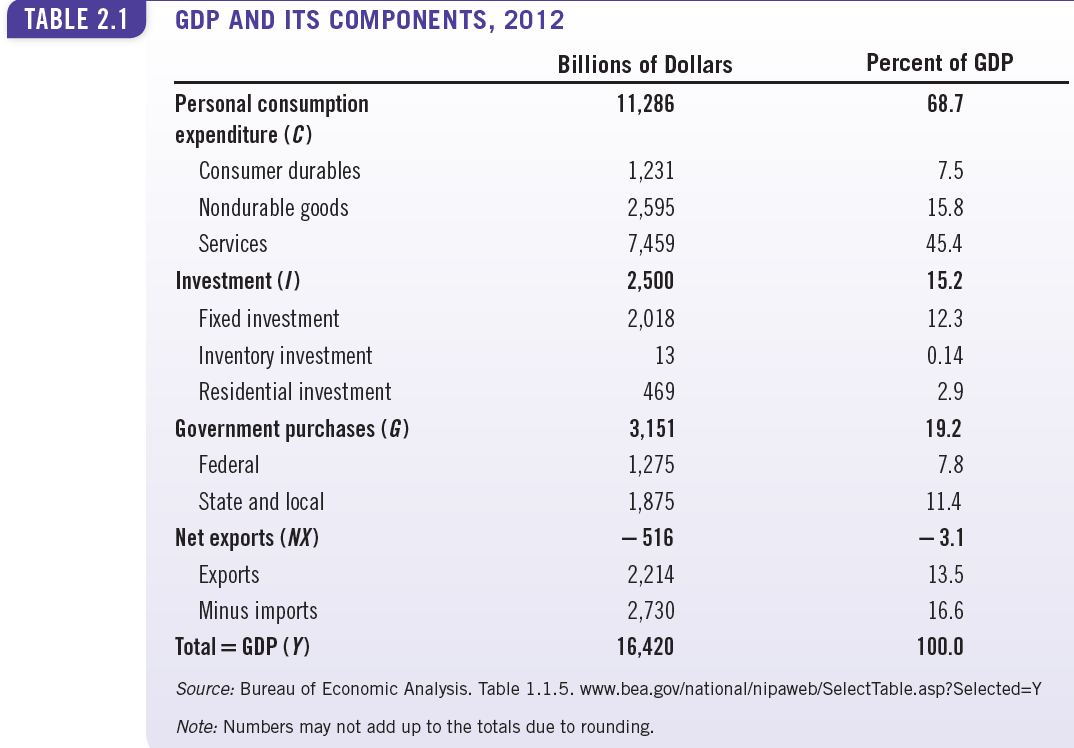
Be Careful With Appearances
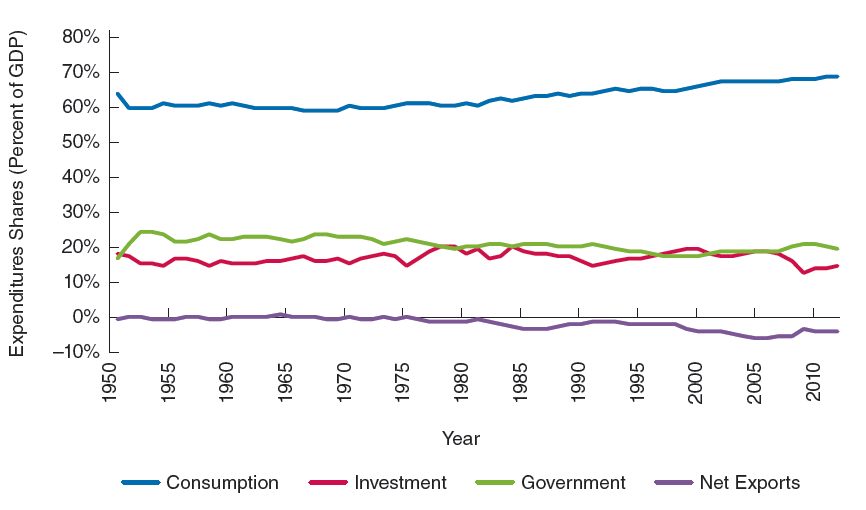
- The textbook gives the impression that the components of GDP have remained relatively stable over time.
- In one exercise, we will show that this perspective is wrong.
The Income Approach
The income approach involves adding up all the incomes received in the economy by households, firms, and the government:
GDP \(=\) Compensation of employees \(+\) Taxes on production and imports less subsidies \(+\) Operating surplus \(+\) Depreciation
- Operating surplus = rents + interest income + corporate profits
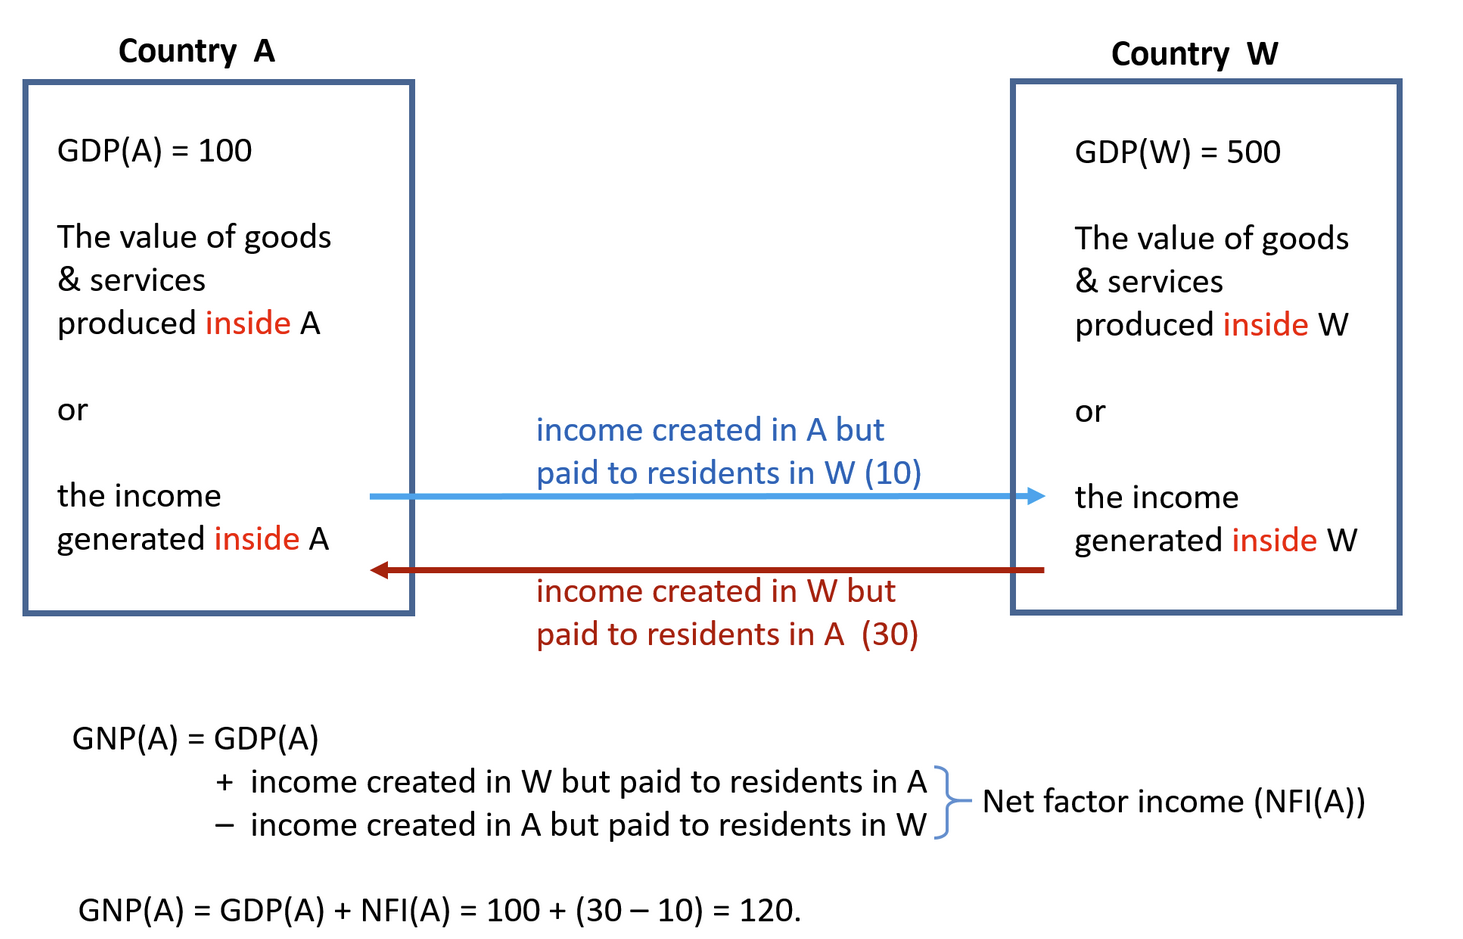
- NFI \(=\) Income received by US residents from investments abroad \(-\) income created in the US but paid to foreign residents abroad
- GNP \(=\) GDP \(+\) NFI
NFI stands for “Net Factor Income”, GNP for “Gross National Product”, and GDP for “Gross Domestic Product”
NFI, GDP, and GNP: an Example
2. Price Indexes
Real vs Nominal GDP
- Nominal variables: variables measured at current prices
- Real variables: variables measured at constant prices
- So, Real GDP is just \[Real \hspace{0.2cm} GDP = \frac{Nominal \hspace{0.2cm} GDP}{Price \hspace{0.2cm}level}\]
- How do we measure the “Price level”?
- The technique of price indexes will do that for us
Fixed Base Year Indexes: Example
Suppose an economy produces only apples & oranges: periods 1,2: \(~~~~~~~~~~~~~~~~~\)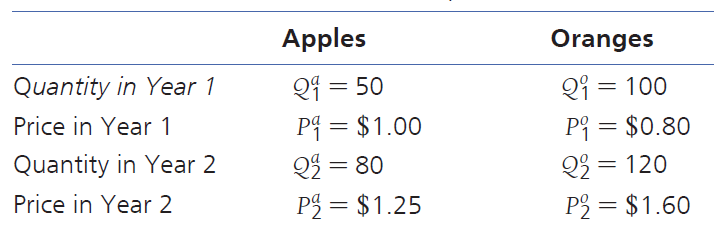
- What is the level of Nominal GDP for periods 1 and 2?
- What is the rate of growth of Nominal GDP between these two periods?
- Using year 1 as the base year:
- What is the level of Real GDP for both periods?
- What is the growth rate of Real GDP between these two periods?
Nominal GDP
Nominal GDP is simply current prices multiplied by current quantities: \[ \begin{aligned} & G D P_1=50 \times 1+100 \times 0.8=130 \text { dollars } \\ & G D P_2=80 \times 1.25+120 \times 1.6=292 \text { dollars } \end{aligned} \]
Nominal GDP grows between periods 1 and 2 at a rate \[ \left(\frac{GDP_2}{GDP_1}-1\right)=124.6 \% \]
The measure of nominal GDP is irrelevant in modern economies because of price changes
Let us calculate the relevant measure of GDP: real GDP
Year 1 as the Base Year: Real GDP
As year-1 is the base year, \(realGDP_1\) has to be equal to nominal \(GDP_1\) \[ realGDP_1=G D P_1=130 \text { dollars } \]
\(realGDP_2\) is calculated as if prices remain constant (those of year 1) \[ realGDP_2=80 \times 1+120 \times 0.8=176 \text { dollars } \]
Using year 1 as the base year, real GDP grows between periods 1 and 2: \[ g_{b_1}=\left(\frac{realGDP_2}{realGDP_1}-1\right)=35.38 \% \]
\(g_{b_1}\) gives the rate of growth between the two years, using year 1 as the base year.
Year 2 as the Base Year: Real GDP
As year-2 is the base year, \(realGDP_2\) has to be equal to nominal \(GDP_2\) \[ realGDP_2= GDP_2=292 \text { dollars } \]
\(realGDP_1\) is calculated as if prices remain constant (those of year 2) \[ realGDP_1=50 \times 1.25+100 \times 1.6=222.5 \text { dollars } \]
Using year-2 as the base year, real GDP grows between periods 1 and 2: \[ g_{b_2}=\left(\frac{realGDP_2}{realGDP_1}-1\right)=31.23 \% \]
\(g_{b_2}\) gives the rate of growth between the two years, using year 2 as the base year.
Problem: Which Base Year Should Be Used?
Using year-1 as the base year: \[g_{b_1}=35.38 \%\]
Using year-2 as the base year: \[g_{b_2}=31.23 \%\]
- So we are left with no definitive answer, if we update the base year.
- From time to time, National Accounts have to update the base year.
- Problem: every time we update the base year, we rewrite the economy’s history.
- How to overcome this problem? Apply the Chain Weighted Index method
- We do not have time for covering this method, but we can learn how to calculate the Price Index.
Calculate the Price Index
After choosing one base year, calculate the Price Index by applying the equation: \[Real \hspace{0.2cm} GDP = \frac{Nominal \hspace{0.2cm} GDP}{Price \hspace{0.2cm}level}\]
If year-1 is the base year, then the Price Index (PI) for year 1 is: \[ P I_1=NominalGDP_1 / RealGDP_1=130 / 130=1 \]
And the PI for year 2, will be given by: \[ PI_2= NominalGDP_2 / RealGDP_2=292 / 176=1.659 \]
As the inflation rate \((\pi)\) is the percentage change in the Price Index, we get: \[ \pi=(1.659-1) / 1=65.9 \% \]
Obviously, we can do the same for the case where year-2 is the base year. Will \(\pi\) be the same? No! Why?
Different Inflation Indicators
In the National Accounts there are many indicators to provide a measure of inflation. Three of the most relevant ones are:
- GDP deflator. It is the price index we learned to calculate in the previous slide.
- Consumer Price Index (CPI). It is the most used measure of inflation in the media and in politics. It represents the percentage change in the prices of a basket of goods and services (G&S) that are representative of the consumption patterns within the country.
- Housing Price Index. It was developed by Nobel Prize winner Robert Shiller and the S&P ratings company. Those that need to buy a house easily understand its importance.
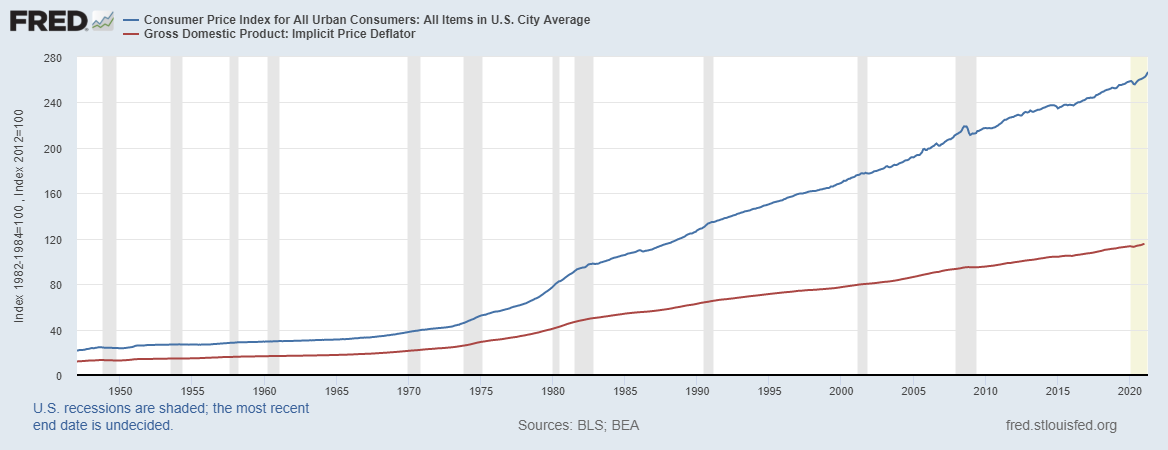
GDP deflator vs CPI
Consumption G&S saw their prices increasing more than those of the other components of GDP since the 1940’s.
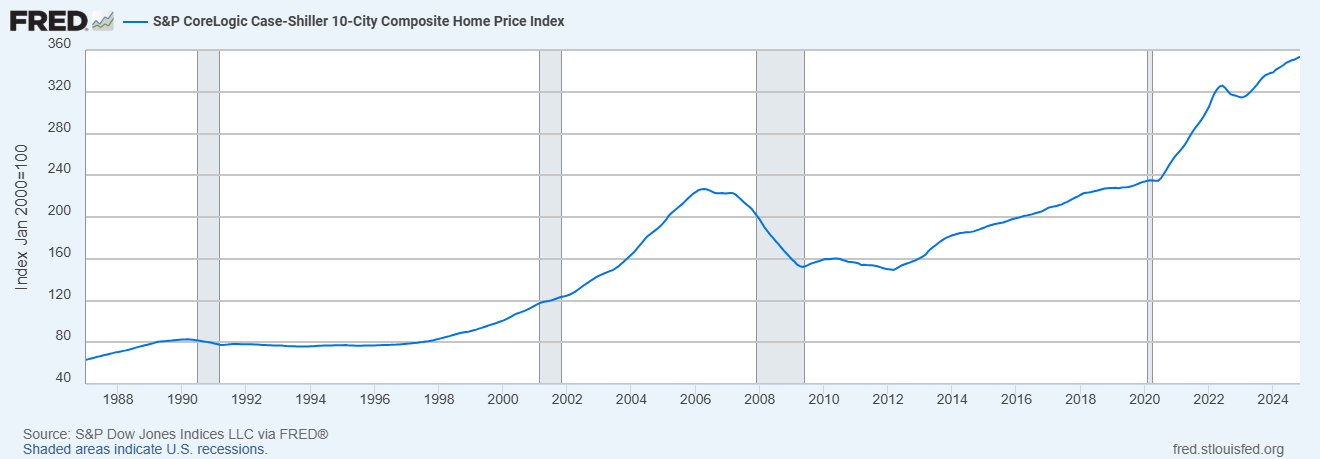
The Housing Price Index
The Housing Price Index started to be developed only in the 1980s, but it is currently one of the most important macroeconomic variables. The financial crisis that started in 2007 was triggered by the burst of a housing bubble.
Some Caution with Price Indexes
- A wrong measure of a price index will lead to a wrong measure of real GDP and social well-being.
- Two fundamental issues are difficult to be captured by price indexes:
Some Caution with Price Indexes
- New goods. The introduction of new goods, the GDP deflator is artificially greater than its true value, underestimating the true value of real GDP.
- Quality improvements. ts are so dramatic that it seems impossible to get a truly accurate measure for the Real GDP deflator. A personal computer may cst today (in real terms) the same as in 1990. But a today’s computer can do hat a million computers could not do in 1990.
3. Other Important Macroeconomic Aggregates
Adult Civilian Population
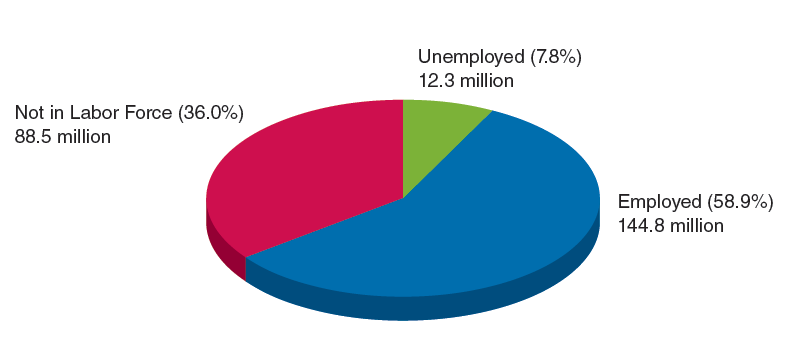
The total adult civilian population [16 to 66 years] is divided into 2 major groups:
- Labor Force = Number of Employed + Number of Unemployed
- Employed. If the person is working, either full time or part time, during the past week, or was temporarily away from his or her job because of illness, vacation, or the inability to get to work because of bad weather.
- Unemployed. If the person did not work during the past week, but had looked for a job over the previous four weeks, or was waiting to return to a job from which he or she had been laid off.
…
- Not in the labor force. If the person did not work during the past week and had not looked for a job over the previous four weeks.
Adult Civilian Population: USA (2013)
The Three Types of Unemployment
The natural rate of unemployment.
- The rate that would prevail if the economy were neither in a boom nor in a bust.
- It is the sum of frictional and structural unemployment
- Frictional unemployment: workers being between jobs in the dynamic economy
- Structural unemployment: labor market failing to match up workers and firms in the market
Cyclical unemployment
- The difference between the actual rate and the natural rate.
- Associated with short-run fluctuations in output
Actual unemployment = frictional + structural + cyclical
Real vs Nominal Interest Rates
Nominal interest rates are only relevant for arbitrage/speculation.
For decision making about real economic activity (long term real investment, buying a house, etc.), relevant is the real interest rate.
The Fisher equation. This equation highlights a simple but very important relationship: \[r = i − \pi\] \(i\): nominal interest rate, \(r:\) real interest rate, \(\pi:\) inflation rate
Under normal conditions, nominal interest rates can not go below \(0\%.\)
What about real interest rates?
Can the Real Interest Rate Be Negative?
Below we plot the most common measure of a short-term real interest rate (3-Month Treasury Bills rate minus the CPI inflation rate in the USA) 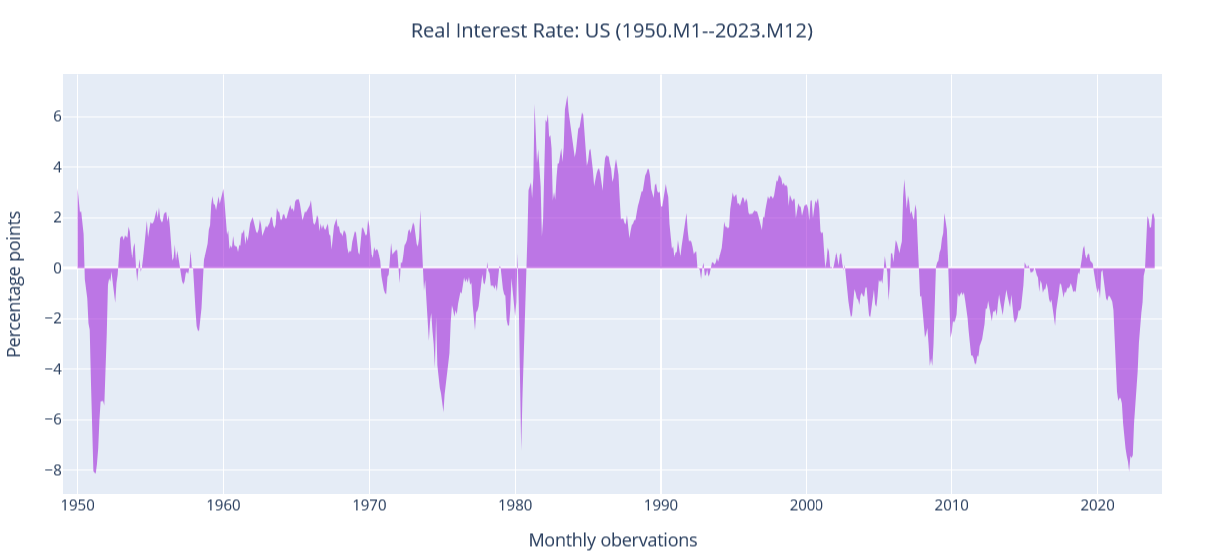 How often was it negative?
4. Readings
Readings
- Read Chapter 2 of the adopted textbook:
- Frederic S. Mishkin (2015). Macroeconomics: Policy & Practice, Second Edition, Pearson Editors.
- Frederic S. Mishkin (2015). Macroeconomics: Policy & Practice, Second Edition, Pearson Editors.
- For the issue of Price Indexes, it is better if you read the section 2.3 “Nominal and Real GDP and Price Indices” in Chapter 2, pages 68–71, in the following textbook:
- Stephen Williamson (2018). Macroeconomics, Sixth Edition, Pearson Editors